What Is an ACBill-Style Calculator and Why It Matters
Use the calculator
Generate your AC cost estimate from this guide
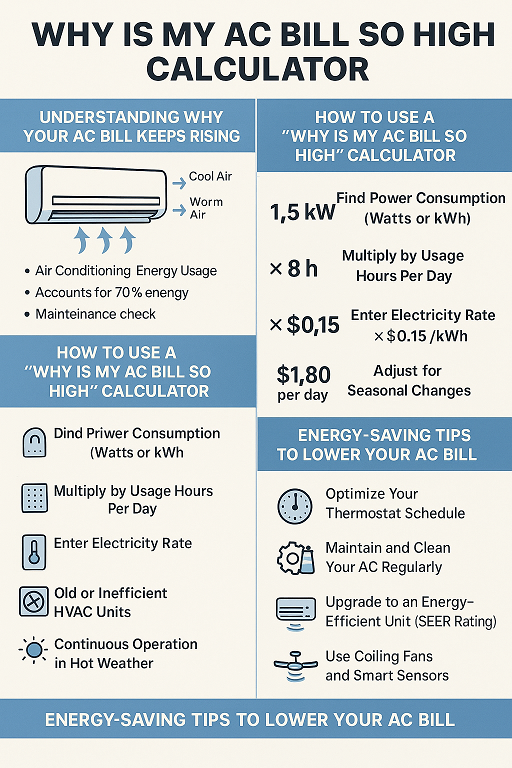
Enter your AC size, runtime, SEER or EER rating, and electricity rate to turn this article into a personal cooling-cost estimate.
What Is an ACBill-Style Calculator and Why It Matters
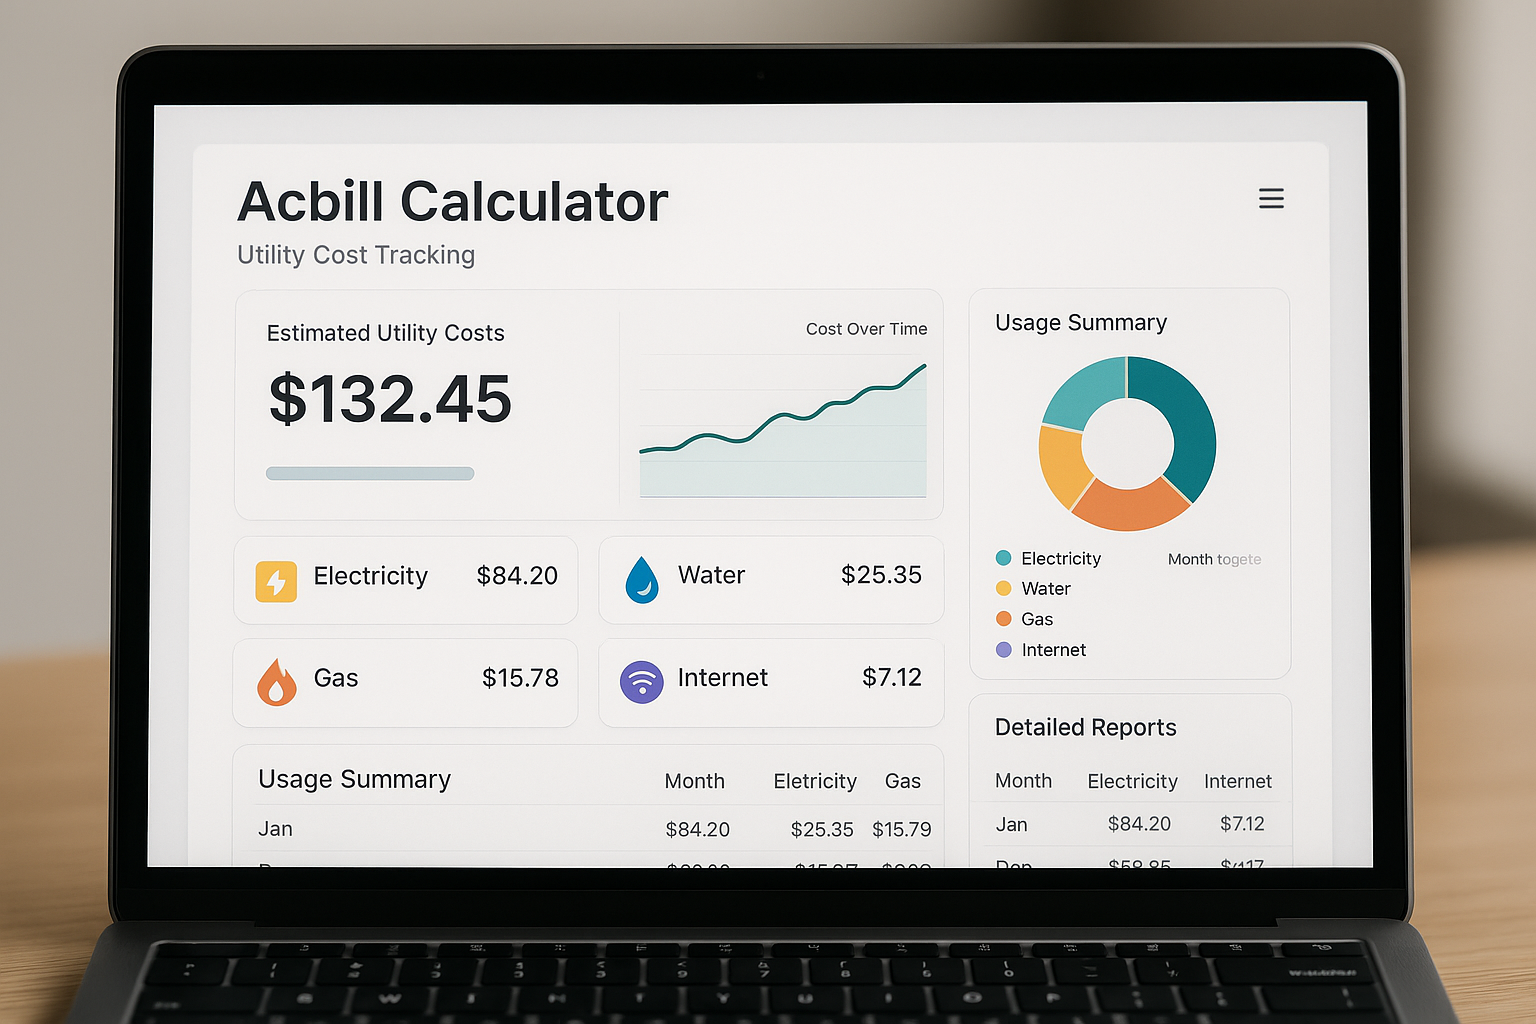
Utility bills can be difficult to understand. The shiny rate cards that suppliers publish with friendly numbers but when it comes to your bill, the final bill is never what you expect. An ACBill-style calculator comes in handy. It converts tariffs, time usage windows, standing charges, taxes and discounts into a single clear comparison that enables you to see the real monthly costs. When you run an ACBill calculator to shop around for utility suppliers you are able to make apples-to-apples decisions with no messy prices.
The problem with utility price sheets
- Fragmented fees: Standing charges, meter fees, minimums and riders are all causes of an increase in your actual price per unit.
- Teaser rates: Early discounts may cover the fact that the long run price could be better.
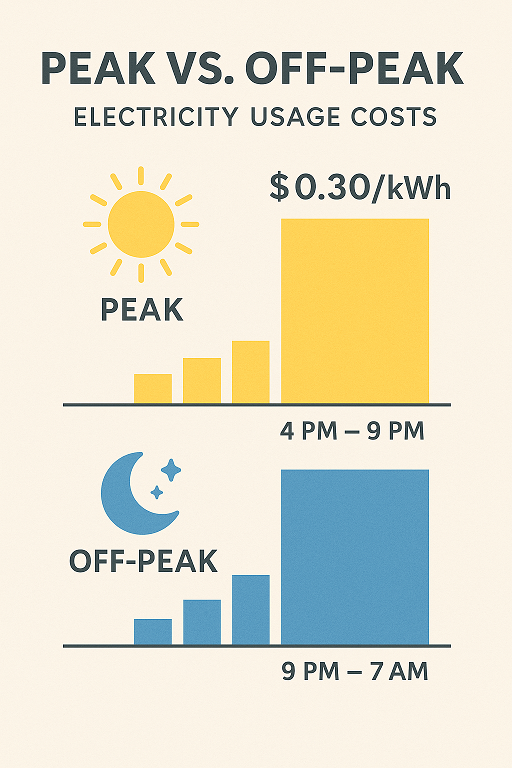
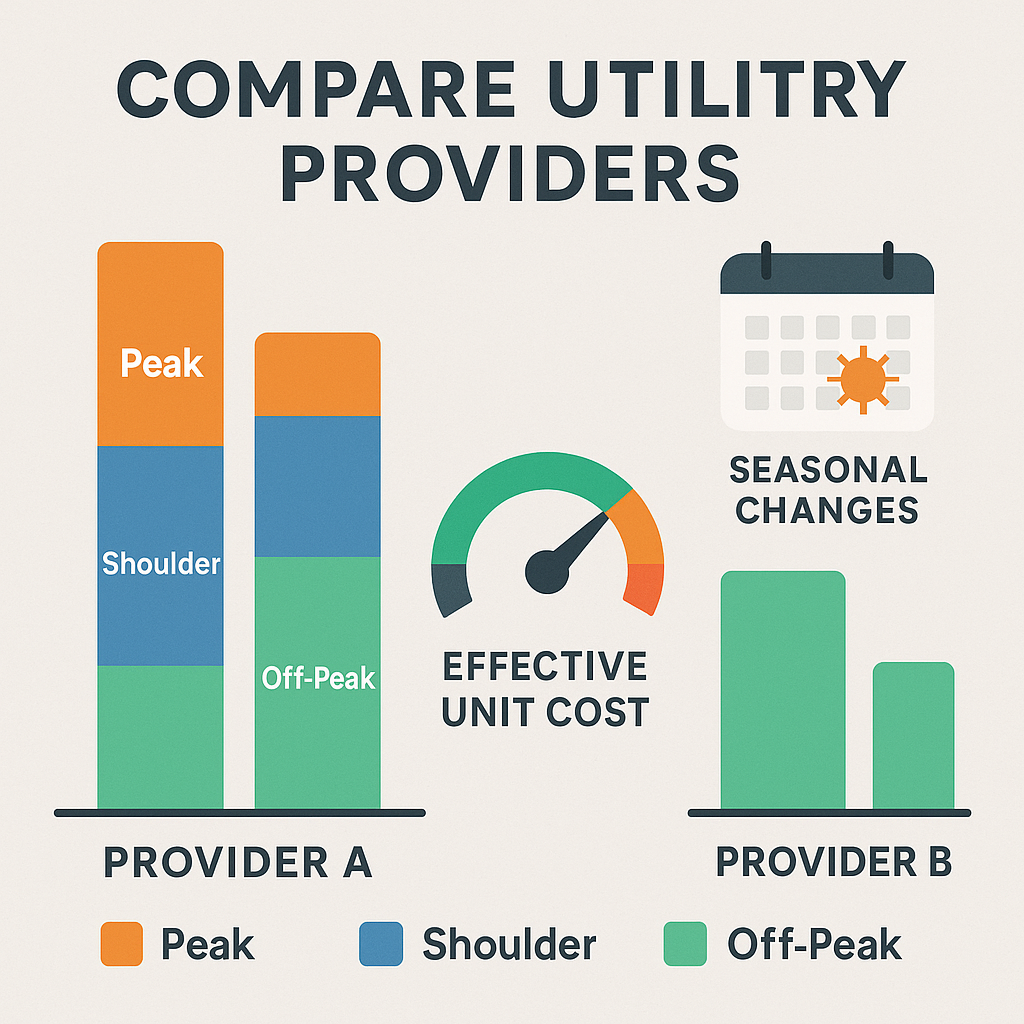
- Complex periods: peak, off-peak, shoulder These vary on a daily, seasonal or weekend basis.
How calculators normalize apples-to-apples comparisons
A powerful calculator puts it all into perspective as a total effective cost to which you actually used it. It takes your consumption in every time window multiplied by the appropriate rate and pluses fixed charges, taxes, and then divides by the total number of units that you consume to demonstrate the effective unit cost. It is the most reasonable way of comparing providers.
How the Tool Works (Input → Logic → Output)
Key inputs: usage, tariff type, peak/off-peak windows
- Usage: Monthly kWh or m 3 and (preferably) a load shape -how your usage varies through the day.
- Type of tariff: Flat and tiered, time of use (TOU) and demand-based.
- Time windows: peak/off-peak/shoulder with exception of seasonal and holidays.
Under the hood: rate cards, taxes, and fees
A reliable comparison engine stores the rate card of each provider: unit pricing based on the window, stand charges, levels of tiers, taxes, environmental charges and rounding. rules. It even simulates promotions (cashbacks, bill credits) and distributes them throughout the term of the contract so that they are fairly compared.
Outputs you can trust: effective unit cost and total bill
- Total monthly cost (all-in).
- Efficient unit cost (total /units).
- Sensitivity bands of change of cost based on a shift in your usage +-10-20%.
- Break-even analysis to indicate when Provider B is cheaper than Provider A.
Step-by-Step: Using an acbill calculator to compare utility providers
Gather your last 3–12 bills
Pull at least three recent bills, twelve being better to get seasonal peaks. Record monthly units, total cost and other special charges. Assuming you already possess a smart meter portal or a spreadsheet of some sort, take it.
Enter time-of-use patterns accurately
Figure out your load shape: What do you think the percent of use is in peak, shoulder and off-peak? With a smart meter, you can read your real interval data (e.g. 15-minute logs). Even a crude division, such as 35% peak, 25% shoulder, 40% off-peak etc will give accuracy a massive boost.
Interpreting the results and what to watch
- All-in total vs. headline rate: It is always important to compare headline cost first.
- Standing charge effects: Fixed fees are more severe to the light users.
- Promo decays: Annualize bill credits; do not take posturing into account in the short term when the steak will be more expensive in the long run.
- Sensitivity tests: When a minor shift in peak share causes the winner to change, then the decision is sensitive to usage- keep track on changing it.
9 Proven Ways to Save with ACBill-Style Comparisons
1) Match plan type to your usage curve
Provided that you consume most of your energy at night, a TOU plan with low off-peak rates can be better than a flat plan, even with higher peak rate. The break-even is measured by the calculator.
2) Exploit off-peak pricing
Dishwasher, laundry, ev charger, and water heating: dishwasher, laundry, EV charger, and water heating should be switched to off-peak windows. Most households are able to relocate 10-30% of them and this will reflect to direct savings by the calculator.
3) Avoid traps: standing charges & minimums
Low use homes can be subjected to a low unit rate with a high standing charge. On the other hand, an ultra-low consumption can be eliminated by a minimum monthly fee.
4) Check tier breakpoints
Tiered rates become less expensive or more expensive beyond the levels. When your usage is approximately at a breakpoint, you may wish to make efficiency adjustments that put you in the lower-cost tier -or plans with no penal tiers.
5) Annualize promos and cashbacks
Issue bonus sign-up credit or entry offers throughout the entire term (e.g. 12 months) to determine the real average price per month.
6) Track price-change clauses
Other variable plans vary quarterly or based on market indices. The sensitivity pane of the calculator lets you determine the risk in case the rates increase by 10%.
7) Bundle smartly (internet + electricity, etc.)
A bundle is good--so long as the marginal price is lower than the alternatives. Put in both situations to compare the actual value of the bundle.
8) Re-run after seasonal shifts
Operate the tool in the summer and winter. The seasonal swings of AC or heating may rearrange the list of providers that is really the cheapest.
9) Negotiate using the data
After finding an optimal competitor price, call your present provider with your actual unit price. Most of them will suit or sweeten to retain you.
Example Walkthrough: From Bill Shock to Calm Switch
Sample inputs and assumptions
- The monthly consumption includes: 350 kW (winter), 500 kW (summer).
- Load shape 40/20/40 peak, shoulder, and off-peak.
- Standing fee: 8/mo (Provider A) 4/mo (Provider B)
- Plan A (TOU): Peak $ 0.27, Shoulder $ 0.19, Off-peak $ 0.13.
- Plan B (Flat): $0.205 per hour and $30 sign up credit (at 12 months = $2.50/mo)
Comparing Provider A vs. Provider B
For 500 kWh summer, Plan A totals:
- Energy cost = 0.4×500×0.27 + 0.2×500×0.19 + 0.4×500×0.13
- = 200×0.27 + 100×0.19 + 200×0.13
- = 54 + 19 + 26 = $99
- Add standing charge $8 → $107
For Plan B:
- Energy cost = 500×0.205 = $102.50
- Standing $4 → $106.50
- Less monthly promo $2.50 → $104
Findings: Plan B prevails over the summer by three dollars. But moving 10 percent off-peak to peak (it is now 30 percent peak, 30 percent shoulder, 40 percent off-peak) Plan A falls by:
- New energy cost = 150x0.27 + 150x0.19 + 200x0.13 = 40.5 + 28.5 + 26 = $95
- With standing: $103 - now Plan A wins.
- Takeaway: Load shifting has the ability to switch the winner even without the provider change.
Decision logic and break-even point
Calculate a sensitivity: when your peak share is [?]33 then in Plan A, 500kWh is less expensive than Plan B. Knowing your break-even assists you in deciding what to do (change behavior i.e. shift usage) vs. what to do (change provider i.e. change plans).
Advanced Tips: TOU, Demand Charges, and Solar
Time-of-use accuracy and automation
In case of smart meter or utility application CSV interval export, then upload the same to calculator and generate accurate TOU splits. The less the distance between your true pattern and the result, the more credible is the outcome.
Demand charges and load shaping
There are some tariffs that are a demand charge, which is a charge on your maximum 15-60-minute spike during a billing period. Appliances should be used with timers and staggered in order to eliminates simultaneous peak. The calculator is supposed to model the demand charges as individual of the energy usage.
Solar + storage: valuation and export rates
In the case of solar homes, self-consumption value versus export credit should be compared. Assuming that you have a battery, time-shift saved energy to reduce peak prices. The tool should be an excellent model of net metering and feed-in tariffs and export caps to display the actual payback.
Common Mistakes (and Easy Fixes)
Ignoring taxes and regulatory fees
Taxes, levies and riders should always be there. A plan, which appears 5 per cent cheaper on the base rate, may turn out to be more costly with charges.
Misreading peak windows
Peak and off-peak are defined differently by various providers--and special provisions usually apply to weekends/holidays. Always have a second look at your time windows on typing in your data.
Falling for teaser rates
Savings can be washed away by intro rates which expire within a period of 1-3 months. Statistical Annualize all promos to make your comparison appropriate to the total contract term.
Feature Checklist for Any Bill Comparison Tool
Must-have inputs and outputs
- Several forms of tariffs: flat, tiered, TOU, demand.
- Minimums, standing charges and maximums.
- Promotions involving pro-rated credit.
- Attributes of tax/fee models.
- Totals and unit costs effective.
- Sensitivity/scenario testing (e.g. +-10% usage; +-10% peak share)
Privacy, transparency, and auditability
Look for:
- Explain mode or clear formulae of every calculation step.
- Storage or high level of privacy.
- Export reports so that you can maintain your own records.
FAQs
1) What information will I require prior to utilizing an ACBill-type of tool?
Your final 3 bills (units and totals) and an approximation of your peak/off peak usage share. Smart meter interval is still better.
2) How frequently shall I repeat my comparisons?
Each quarter, and every time of significant change - season change, new appliances, EV charge, or a change in the price of a provider.
3) Is effective unit cost a trustworthy primary measure?
Yes. It is the most reasonable apples-apples figure since it will contain all the charges divided by the total units. Nevertheless, check the terms and conditions regarding price change.
4) But what in case my usage is very irregular on a monthly basis?
Take a 12 month average and proceed to run high/low scenarios. Compare who is the best provider in both.
5) What does promotions really do to my bill?
Divide all promos or credit in the entire term of the contract. A 12-month contract with a credit of 60 will reduce your average by 5/month -that is all.
6) I have rooftop solar. Should I still compare providers?
Absolutely. Export rates, buyback rules, and fixed charges vary widely. A good calculator will show your net cost after self-consumption and exports.
7) Will switching affect my service reliability?
In most markets, the wires company maintains reliability. You’re switching the billing supplier, not the physical infrastructure.
8) Is there a “best” plan type for everyone?
No. The best plan matches your usage curve, appliance schedule, and comfort preferences.
Conclusion and Next Steps
Comparing utility providers using the Acbill Calculator turns estimating into a precise and data-backed decision. Start by dividing your most recent bills by realistic time of use and compare the total cost and effective unit cost between different providers. Repeat the analysis every season, especially in case of price fluctuations or changes in your lifestyle. By monitoring some load-shifting habits, being mindful of fixed charges and keeping a clear view of promos, you can ensure some valuable savings in the long run.
Key Takeaways
- Use your actual electricity rate from your utility bill whenever possible.
- AC cost changes most with runtime, system efficiency, local climate, and maintenance condition.
- Calculator results are planning estimates, not a replacement for a utility bill or professional HVAC diagnosis.
- For a personalized number, run the same scenario in the AC Bill Pro calculator.
Related AC Cost Resources
Editorial Methodology
AC Bill Pro reviews AC cost guidance against the standard kWh cost formula, SEER/EER efficiency assumptions, and publicly available energy-efficiency guidance. This article was last reviewed on September 25, 2025. Use your own utility rate for the most accurate estimate.
About the Editorial Team
The AC Bill Pro Editorial Team writes educational cooling-cost guides focused on calculator methodology, electricity-rate inputs, AC efficiency, and practical homeowner decisions.
Read about our review process